Easy Shot Volume Solver: Since ‘03-04
My offensive philosophy is that we’re going to run. We’re going to try to make the other team’s players run faster and longer than they ever have run in their lives . . . because if I’m better than you are, the more possessions we play, the more likely it is that I’m going to beat you. If I play golf against Tiger Woods for one hole I might beat him, but over 18 holes, I have no chance.
Roy Williams with Tim Crothers, Hard Work: A Life on and off the Court
Any team coached by Roy Williams believes rebounds are a key to its success. It’s the modus operandi of the Tar Heels since Williams has been on the bench.
The recipe is simple.
If Carolina gets more rebounds than their opponent, Carolina has more opportunities to score.
As Williams put it, I might be able to beat Tiger Woods on one hole, but there is no chance I beat him if we play 18 holes.
Williams isn’t alone in his belief in the importance of rebounds. Pioneer of basketball analytics, Dean Oliver, includes offensive rebounding as one of four factors of success.
More possessions, more opportunities to score.
Another one of the four factors is avoiding turnovers. A turnover is an empty possession.
Fewer possessions, fewer opportunities to score.
This leads us to an interesting intersection of these two factors.
Taking care of the ball and rebounding your misses is a good way to safely navigate your way around an off night on the perimeter.
John Gasaway, Basketball Prospectus | ESPN Insider
Gasaway identified this relationship between rebounding your misses and taking care of the ball, and built a way to measure it.
He calls it ESVS or the Easy Shot Volume Solver.
ESVS = OR% + (100 - TO%)
It’s defined as a team’s offensive rebound percentage added to its percentage of effective (turnover-less) possessions.
For example, the 2018 Tar Heels had an ESVS of 120.7 on offense.
Carolina rebounded 37.4 percent of their misses and turned it over on 16.7 percent of their possessions, or put another way, 83.3 percent of possessions were turnover-free.
ESVS = 37.4 + (100 - 16.7) = 120.7
What does this all mean?
The insight with the metric is the idea that taking shots is just as important as making shots.
As Ole Roy said, you get the ball, and I get the ball.
You want to make the most of your chances with the ball.
This includes your first chance, so avoiding turnovers.
And your second chance, rebounding your own misses.
Realize it’s far from a magic bullet.
Remember, there are two other factors that makeup the four factors.
Effective field goal percentage or how effective a team is at making shots. Of course, that’s important.
And getting to the foul line. Another opportunity to add points to the scoreboard.
This metric is useful answer to this question:
Can this team overcome a poor shooting night?
Shooting involves a good amount of luck. Here’s some evidence via Jordan Sperber.
Or how Sperber put it in this March 2012 post:
By relying less on result of shots and more on quantity of shots, UNC increases their chances of PLAYING LIKE UNC on any given night. If UNC plays like UNC they should be considered a top Final Four candidate and beyond.
Jordan Sperber, TeamRankings post
So, how has Carolina performed in ESVS over the years?
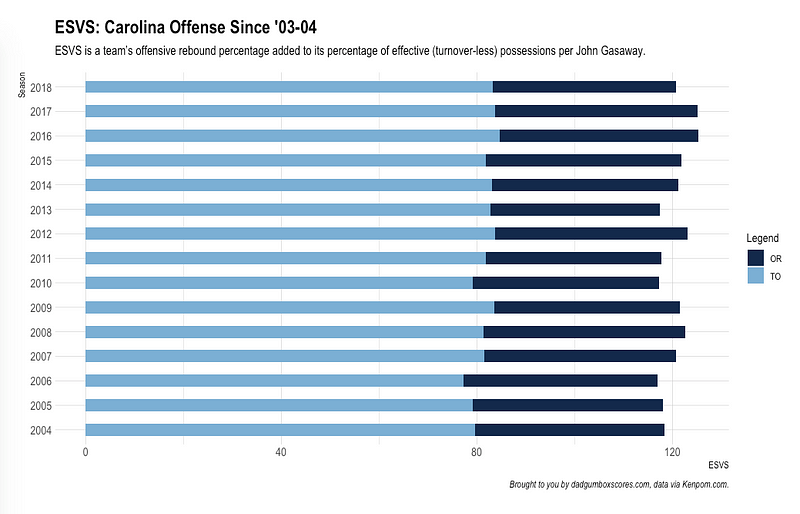
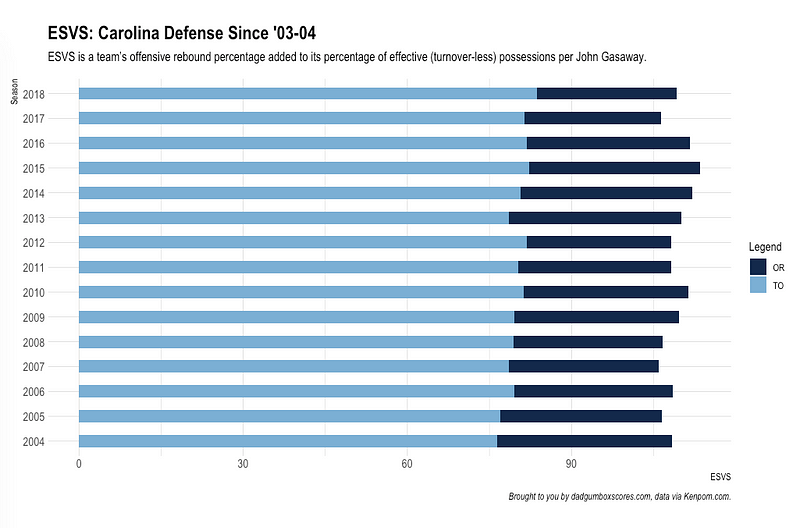
These two graphs show Carolina’s ESVS on both offense and defense since 2003-04.
The following graph shows how this number has changed compared to the Division-I median during the same time frame.
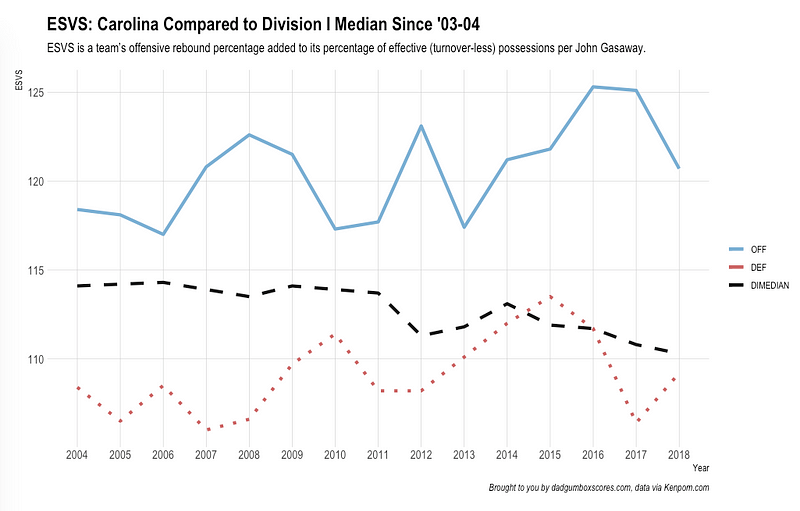
In the Roy Williams era, the Tar Heels routinely register a better offensive ESVS than the rest of Division-I college basketball.
And on the defensive end, Carolina has posted a better defensive ESVS than the Division-I median in all but two seasons (2015, 2016). The 2016 squad posted an identical ESVS on defense to the D-I median.
This table shows the raw ESVS numbers compared to the D-I median, including a difference column that takes the offensive ESVS and subtracts the defensive ESVS.
Note: When Gasaway runs this metric, he only uses conference games. Not all games. For this exercise, we’re including every single game where competition might be more volatile. Our analysis is a bit more shallow than specific.
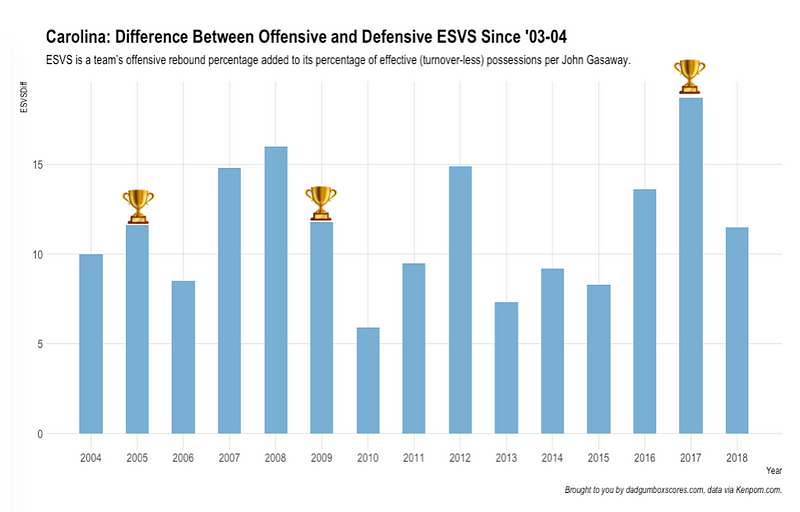
Notice anything about the largest totals in the difference column?
If you sort the difference totals, you’ll find the largest margins for these seasons:
2017: +18.7
2008: +16.0
2012: +14.9
2007: +14.8
2016: +13.6
2009: +11.8
2005: +11.6
You know what else happened in those seasons?
Carolina finished the season in the Elite Eight or better, including three National Championships.
Again, don’t fall in love with this metric as a magic bullet.
Last season’s squad posted a margin of +11.5, quite close to both 2005 and 2009.
Other factors are absolutely important in a team’s success. And trends and how teams are playing the game are changing too. A true comparison requires a deeper and more specific analysis.
But what this metric does well is answer that question.
Can this team overcome a poor shooting night?
And they’re might not be a better example than the 2017 National Championship squad.
The 2017 Tar Heels pulled down a rebound on 41.3 percent of their misses and avoided turnovers on 16.2 percent of their possessions.
This is good for an ESVS of 125.1.
ESVS = 41.3 + (100-16.2) = 125.1
Only the 2016 Tar Heels (125.3) posted a higher ESVS, and that season ended in April too.
The 2017 NCAA Tournament run wasn’t anything like the domination of 2009.
It felt improbable, lucky at times, and it was absolute grind.
Take the ESVS for the six NCAA Tournament games, which includes four games decided by 7 points or less.
The Tar Heels posted a lower effective field goal percentage than their opponent in three of the six games (Gonzaga, Oregon, and Arkansas).
Carolina survived poor shooting nights in that tournament.
Why?
Because the Tar Heels limited turnovers and grabbed offensive rebounds.
More possessions, more chances to score.
So, what else?
ESVS or easy shot volume solver combines two of the four factors in a fascinating way.
Turnover percentage and offensive rebounding have a unique relationship.
Both factors can lead to more opportunities for a team to score.
There is an order of operations though.
A team can’t rebound a missed shot, if it turns over the ball before taking a shot.
For example, the 2018 Tar Heels rebounded 48.7 percent of their misses, but turned the ball over on 32.2 percent of their possessions at Virginia this past season.
Carolina’s ESVS was still 116.5, but Virginia’s ESVS of 111.7 wasn’t far behind. The Tar Heels took only one more shot than the Cavaliers.
The Wahoos wacked Carolina to win that game by 12 points.
ESVS is descriptive enough to explain ways a team generates shots.
It can explain how and why a team can survive a poor shooting night too.
And when teams are evenly matched, it provides an insight into an advantage for one team.
Consider the 2017 National Championship game as an example:
- Gonzaga made 42.1 percent of three-point shots to the Carolina’s 14.8 percent clip
- The Zags effective field goal percentage was 40.7 compared to 38.4 for the Tar Heels
- Carolina rebounded 28.8 percent of their missed shots, and Gonzaga snagged 27.9 percent of their missed shots
- The Bulldogs posted a higher free throw rate (44.7) to Carolina’s (35.6)
So where was the edge?
95.6 percent of Carolina’s possessions were turnover free, and only 81.1 percent of Gonzaga’s possessions were without a turnover.
Carolina’s ESVS was 123.4 to Gonzaga’s 109.0 mark.
The Tar Heels took 14(!) more shots than the Bulldogs and won the game by six points.