Experienced Talent: Curious Continuity
Prior to the start of the 2015-16 season, Roy Williams was asked about the challenges of getting an experienced team to grow as a group.
Theres no question younger players can take bigger leaps, because they havent proven they can do it so you dont know if they can. I like an experienced team; they have been easier to coach. They understand those difficult moments in the locker room, they also understand those good moments in the locker. I do, I challenge them all the time: be the best player you can be and then lets get everybody together and be the best team that you can be.
Everybody would take talent. Every coach in here that you asked would you rather have talent or experience, everybody would take talent. But if you cant have talent, the second one would be experience. The one that everybody would really want would be that experienced talent, which I think we had in 09 particularly and I think we had it in 2012 as well, but I dont think we have it at that level right now like we did in those years.
Roy Williams, Q&A transcript from Sherrell D. McMillan and Inside Carolina
Experienced talent.
How can you measure that?
Ken Pomeroy tries to measure it through minutes continuity.
So what’s minutes continuity?
Minutes continuity is the percentage of a teams minutes that are played by the same player or players from last season to this season.
It uses a percentage of a player’s minutes played because of injuries and a player’s increased or decreased role season to season.
It takes each player on the current roster, uses the minimum minutes (on a percentage basis) he played comparing this season and last season, and then takes the sum for all players.
Can you share an example?
Let’s use the 2015-16 North Carolina team as an example. Below are the minutes from the 2014-2015 season to the 2015-2016 team. The far column includes the minimum value.
The sum of the last column is 75.7. Carolina had the same individuals play around 76% of the minutes from 2014-2015 to 2015-2016 season. That was good for 12th amongst all Division-I teams in the 2015-16 season.
The Division-I median for minutes continuity in 2016 was 49.2. Carolina was +26.5 compared to the Division-I median that season.
Does minutes continuity translate into success?
This is a tricky question. Let’s try to answer it comparing Carolina teams over the past 15 seasons or during the Roy Williams era.
But how are we defining success?
There are a few different ways to do so:
- winning percentage
- how far a team makes it in the NCAA Tournament
- end of year KenPom, Haslametrics, T-Rank, Massey ratings
Winning percentage is somewhat telling of success. Not perfect though.
The same with NCAA Tournament results. It feels off to use this a measure for success because the best team doesn’t always win the NCAA Tournament. Lots of randomness in a single elimination event, however, it’s ultimately how we all remember certain teams.
Different metrics based sites rankings? This feels closer to what we want. A bit less noisy.
Specifically, we’ll use adjusted efficiency margin provided by KenPom since we’re already using Pomeroy’s minutes continuity numbers.
What’s adjusted efficiency margin?
It’s how Ken Pomeroy rates teams.
The adjusted efficiency margin shows the number of points a team would be expected to outscore the average Division-I team over 100 possessions without adjusting for location of the game.
For example, in the 2017-2018 season, if Villanova played the average Division-I team on a neutral court, on average, Villanova would win a 100-possession game by about 34 points. It used adjusted offensive efficiency and adjusted defensive efficiency.
Villanova’s AdjOE is 127.8 and AdjDE is 94.0.
AdjEM = 127.8 - 94.0 = 33.8
So, how’s it shake out for Carolina?
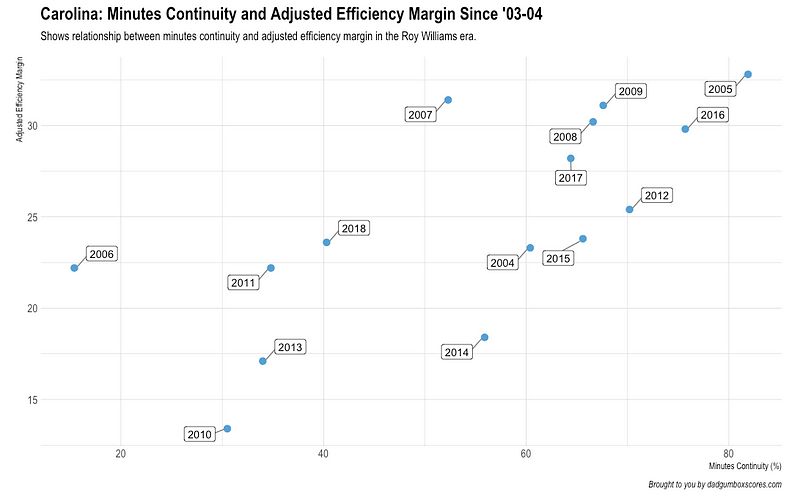
This graph shows how Carolina’s minutes continuity relates to adjusted efficiency margin over this past 15 seasons.
And the raw numbers, including the Division-I median and difference for seasons 2008-2018.
The three highest minutes continuity seasons over the last 15 years?
-
81.9 in 2005
-
75.7 in 2016
-
70.2 in 2012
Champions. Runner-up. Elite 8 (shakes fist).
And the three highest adjusted efficiency margin seasons during this time frame:
-
32.8 in 2005
-
31.4 in 2007
-
31.1 in 2009
Two championships. And an Elite 8 finish.
This is convincing, but correlation doesn’t imply causation.
However, look at the three lowest minutes continuity seasons:
-
15.4(!) in 2006
-
30.5 in 2010
-
34.0 in 2013
A couple second round exits in the NCAA Tournament. And a runner-up finish in the NIT.
It’s safe to say Carolina’s end of season results tend to be better when continuity is above the Division-I median, and its end of season results are worse when below the Division-I median.
But is this how it works for all of college basketball?
Whew. That’s a loaded question.
Let’s try to get an idea of how minutes continuity correlates with teams making the Final Four since 2008.
Be suspicious again because the NCAA Tournament is a lottery. Single elimination. Shit happens. Virginia lost to a 16-seed UMBC.
Here are the raw numbers:
And a chart that shows the differences:
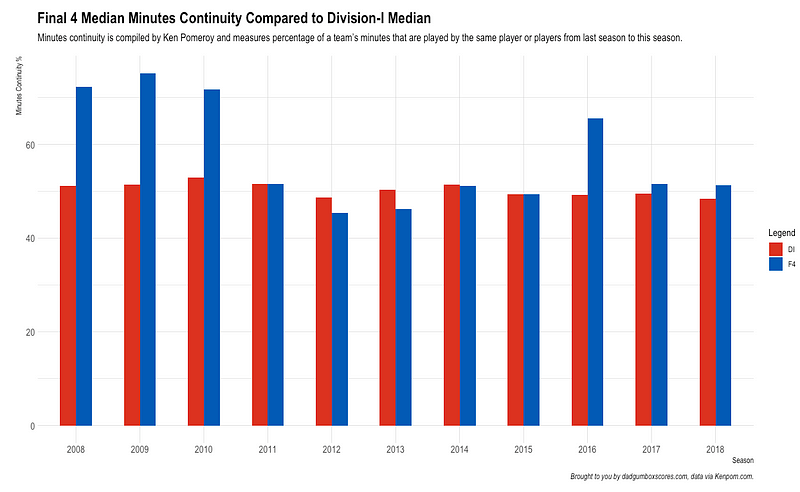
From 2008-2010, it was clear teams with more continuity made the Final Four. After the 2010 season, it became less likely a team with high continuity was in the Final Four.
In fact, Final Four teams from 2011-2015 had a median minutes continuity lower than the Division-I average in those respective seasons.
The past three seasons have all shown teams with higher minutes continuity than the Division-I median have made the Final Four, however, it’s not as consistent or as large as those seasons from 2008-2010.
A few additional notes on this information:
- 2010 Butler had the highest continuity of any team in this bunch (93.2!)
- 2011 Kentucky had the lowest continuity amongst these teams (16.7)
- 2015 Duke had the lowest continuity of a National Champion (38.1)
- 2008 Kansas had the highest continuity of a National Champion (82.6)
2015 Duke (38.1), 2011 Connecticut (43.7), and 2012 Kentucky (44.0) are the only squads to win a National Championship since 2008 with a minutes continuity below the Division-I median.
So, does that mean minutes continuity is less important now?
Maybe?
Minutes continuity somewhat shows the experienced talent of a team. But what about just talent?
The one-and-done era has exploded to the point that they’re making rule changes around it.
Duke has 14 one-and-done players since 2010, and Kentucky has 25(!) one-and-done players in the same span.
Talent is talent. It can beat experience. See 2012 Kentucky and Anthony Davis, or 2015 Duke and Tyus Jones.
But also maybe not?
Villanova and North Carolina have three National Championships and four Final Four appearances combined over the last three seasons.
The minutes continuity of those championship squads is well above the Division-I median.
And since 2010, these four teams (Duke, North Carolina, Villanova, Kentucky) have a combined six National Championships.
Here’s a chart that shows how minutes continuity has changed amongst these four teams compared to the Division-I median since 2010.
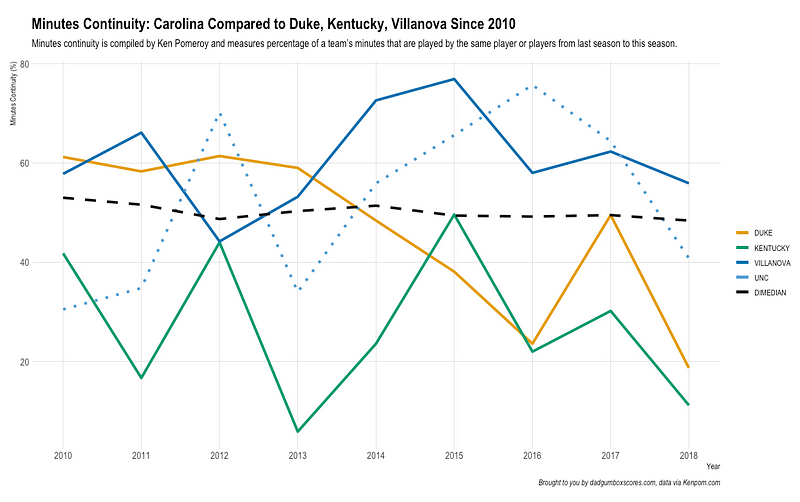
It’s clear Villanova and Carolina have tried to rely on more experienced talent versus Duke and Kentucky that go the talent only route as of late.
A team full of completely talented freshman hasn’t exactly struck gold.
2015 Duke had a minutes continuity of 38.1 (senior Quinn Cook was critical to that team).
And 2012 Kentucky had a minutes continuity of 44.0 (sophomore Terrence Jones and Doron Lamb were big parts of that squad).
Minutes continuity might be less telling of pure success as of late, however, it doesn’t mean it’s not a good indicator of potential success.
So, what about Carolina in 2018-19?
Roy Williams wants experienced talent. This is after a season where Carolina had its lowest minutes continuity (40.8) since the 2013 season.
Minutes continuity should increase slightly this upcoming season because the Tar Heels return four players that all played 30% of available minutes on their own.
It might be more useful to look at continuity across positions for Carolina. Specifically, at the point guard and center/power forward positions.
Point Guard
Carolina has had a few seasons where point guard continuity was a bit tricky.
In 2006, only sophomore Quentin Thomas had a little experience. A freshman Bobby Frasor quarterbacked that squad and became the only freshman in the Roy Williams era to start every game in their rookie campaign.
2010 left Carolina with sophomore Larry Drew, who spilt some time with a freshman Dexter Strickland. That season was one to forget.
And in 2013, freshman Marcus Paige emerged at the position, however, senior Dexter Strickland was around to help at times.
2006, 2010, and 2013 weren’t exactly trademark seasons for the Tar Heels.
The 2018-19 squad has a massive void at this position.
Consider Jalek Felton played a higher percentage of available minutes than Seventh Woods last season. While Woods is entering his junior season, he has never played consistently.
This means Carolina might be relying on transfer K.J. Smith to play like his father or rely on raw talent in freshmen Coby White and Leaky Black.
Will the talent and inexperience be enough at this critical position?
Center/power forward
Again in 2006, Carolina need to replace almost the whole roster. At this position, it helped to have a senior Byron Sanders and a freshman Tyler Hansbrough. David Noel had experience playing amongst big men as did a young Reyshawn Terry too.
In 2013, the Tar Heels had a hole at this position with only sophomore James Michael McAdoo returning to the team. Desmond Hubert and Jackson Simmons filled in a lot as sophomores, and there was a big learning curve for freshmen Brice Johnson and Joel James.
But that hole was nothing like the one last season in 2018. Luke Maye returned in an increased role, but no real continuity beyond that at these positions. Graduate transfer Cameron Johnson is more of a small-forward, and Johnson was brand new to the team too.
The freshman trio of Garrison Brooks, Sterling Manley, and Brandon Huffman were relied on to anchor this role on the team. And it was a tall order.
But it means Brooks, Manley, and Huffman all have a season under their belts now.
So, this upcoming season will be interesting
Because there is experience coming back. Maye and Kenny Williams are seniors. Cameron Johnson is a graduate senior. These are talented players.
Brooks, Manley, and Huffman have experience too. It’s not a ton, but it’s better than nothing.
Woods hasn’t played a ton, but he’s been in the program for multiple seasons.
Players like Andrew Platek, Brandon Robinson, and K.J. Smith all have some experience.
Plus, the talent level of the inexperienced players is better than its been in a long time. Nassir Little, Coby White, and Leaky Black are highly touted. Some call it the best class ever for Roy Williams.
Would you have talent or experience?
Roy Williams wants both, and he just might get it this upcoming season.