In Defense of Turnovers
If you had to list out the bugaboos for the 2018 Tar Heels, defense should be on your list.
The facts are staggering:
- opponents shot 38 percent from behind the three-point line (worst in Roy Williams era)
- highest offensive points per possession (1.28) in a loss in Roy Williams era (Miami scored 1.32 PPP)
- 96.7 adjusted defensive efficiency (worst in Roy Williams era)
- five different opponents shot 50 percent or better from behind the three-point line
- a 50.1 effective field goal percentage (second worst in Roy Williams era)
- 16.3 defensive turnover rate (worst in Roy Williams era)
Pick your poison. Carolina was the opposite of good on defense. Below-average. Bad.
Why?
Let’s start with a few examples of how a possession can end:
-
a made shot (either a three-point shot or two-point shot)
-
a turnover (either a live-ball or dead-ball turnover)
-
a missed shot where the defense rebounds the ball
-
a foul in the act of shooting that brings a player to the foul line, and a made foul shot or missed foul shot where the defense gets the rebound
Opponents were effective shooting the ball at a 50.1 percent clip last season. There were 134 teams in the country that posted a better defensive effective field goal percentage than Carolina.
Carolina rebounded 74.5 percent of opponents’ missed shots. This ranked 46th in the country. Opponents extending possessions by snagging offensive rebounds generally was not an issue last season.
The Tar Heels avoided fouls at an above average rate as well. The defensive free throw rate of 26.0 was the seventh best under Roy Williams.
And then there are turnovers. Carolina’s defensive turnover rate was 16.3 percent.
What does that mean?
It means 83.7 percent of opponents possessions did not end in a turnover.
If the possession didn’t end in a turnover, and the Tar Heels were above average at keeping opponents off the foul line and the offensive glass, it leaves only one other option.
Shot attempts. Makes or misses.
As poor as Carolina was defensively, opponents can’t score if they turn it over or don’t get to shoot.
Tackling Turnovers
First, the defensive turnover rates for each season from 2003-04 to 2017-18 are relatively noisy. Because the game has changed over the last 15 years.
How it’s officiated. The rules. The competition. And strategies of certain teams.
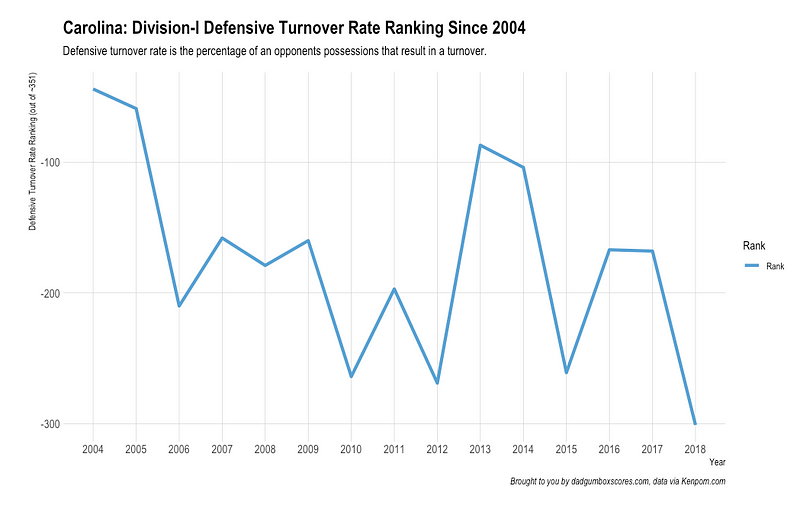
So rather than share the raw defensive turnover rates, let’s show how the Division-I ranking in defensive turnover rate has changed season to season in this chart.
We’re reversing the rankings as negative because it better illustrates a higher ranking is worse than a lower ranking in this category.
And this chart shows the defensive turnover rates, Division-I rankings, and Division-I median during the same time frame:
Before last season, Carolina’s defensive turnover rate was somewhat pedestrian compared to the Division-I median outside of two way above-average seasons in 2004 and 2005.
Last season?
Not great.
The 16.3 clip ranked 301st in the country. It was over two full percentage points lower than the Division-I median.
So why was Carolina’s defensive turnover rate this poor?
Turnovers are somewhat of a mystery. A defense can absolutely force turnovers, and an offense can certainly give the ball away too.
The blame game for turnovers is almost like flipping a coin. It’s typically equal parts good defense and bad offense.
Tough schedule?
Last season, Carolina played a tough schedule. It’s overall strength of schedule was the most difficult in the country according to Ken Pomeroy’s adjusted efficiency calculation.
In normal terms, Carolina opponents would beat an average team by about 13 points. That’s better than any opponents of another team.
Tar Heel opponents posted an adjusted offensive efficiency of 111.6, which ranked fifth amongst all Division-I teams. These were efficient offenses that avoided turnovers.
But strength of schedule can’t be the only reason why the defensive turnover rate was so low. Remember, turnovers are equal part good defense and bad offense.
Personnel?
The Tar Heels lost several key contributors from its 2017 Championship squad. This translated into Carolina have its lowest continuity since 2013.
Carolina simply didn’t have any experienced big men. The void in the post meant the Tar Heels were a little overly concerned about protecting the paint, and this often cascaded into wide open looks from three-point land for opponents.
Textbook example of 3PT defensive trouble here
— chris (@dadgumboxscores) January 31, 2018
Drive-and-kick for 3 pic.twitter.com/mLgnEfJimJ
Inexperienced big men weren’t the only personnel changes. Nate Britt and Justin Jackson were big losses to the team’s defense.
Everyone highlights Jackson’s offense, however, his defense was maybe more important to Carolina during its run to the title in the NCAA Tournament. Jackson had 5 steals in the win over Arkansas, kept Kentucky’s Malik Monk somewhat human, had a pair of steals against Oregon, and had a couple blocks in the championship win over Gonzaga.
Britt was more of a role player off the bench. He also led the Tar Heels in steal percentage (2.8) in 2017. The highest steal percentage this season for a Tar Heel was just 2.0 (Joel Berry II, Theo Pinson).
So, Carolina played against outstanding offenses and its personnel was a little green. These are two explanations for the poor defensive turnover percentage.
Any others?
Before we answer that, we first need to establish something.
Turnovers aren’t created equal
A turnover can happen in a variety of ways, including:
- steal
- player steps out of bounds
- 10-second backcourt violation
- shot clock violation
- double-dribble, traveling, palming
- offensive foul
- 3-second violation
- moving or illegal screen
- 5-second violation
- jump ball possession arrow
The majority of these turnovers are of the dead-ball variety meaning the opposing team takes the ball out of bounds and gains possession.
A steal is a live-ball turnover. The opposing team gains possession without any stoppage of play.
Not all turnovers are created equal
— chris (@dadgumboxscores) September 19, 2018
Dead-ball or live-ball
Non-steal or steal pic.twitter.com/CZxetaOz06
Live-ball or dead-ball. Steals or non-steals. Turnovers aren’t created equal.
So, what?
Non-steal turnovers are influenced by the defense, however, not as much as steals are influenced by the defense.
And how do you measure steals?
Steal percentage or a percentage of possessions that end in a steal is one way. And guess how Carolina’s defensive fared in steal percentage last season?
The 2018 Tar Heels registered an 8.0 defensive steal percentage. The lowest steal percentage over the last 15 seasons or under Roy Williams.
What percentage of opponent turnovers were steals versus non-steals?
In the 2018 season, 50.8 percent of opponent turnovers were non-steals and 49.2 percent were steals. This ties the 2010 Tar Heels for the second lowest non-steal turnover percentage in the last 15 seasons (2011, only 43.9 of opponent turnovers came on steals).
This table shows defensive steal percentage compared to the Division-I median, and a percentage of defensive turnovers from steals and non-steals since the 2003-04 season.
So, what does this mean?
Carolina recorded its lowest defensive steal percentage in the Roy Williams era last season. Only one other season, 2011, had a lower D-I defensive steal percentage ranking (238) than this past season’s ranking of 226.
Steals are important too. Because a steal often leads to higher offensive efficiency on the other end of the floor with easy buckets from fast break chances. The hallmark of any Roy Williams coached team is the primary and secondary break. Steals help with that.
A few years ago, FiveThirtyEight estimated when an NBA player gets an additional steal per game it can be as valuable as nine more points per game for its team. Steals are considered one of the more predictive statistics, and it’s clear steals make a difference.
With the absence of steals, the 2018 team also had the worst defensive turnover percentage in the Roy Williams era.
This chart shows the Division-I ranking for defensive turnover rate and steal percentage since the 2003-04 season.

Last season, the Tar Heels simply didn’t force enough turnovers or benefit from opponents turning it over enough either. Plus, a larger share of opponents turnovers were from non-steals than steals.
The reasons why include a stout schedule, inexperienced personnel, and a dismal defensive steal percentage.
This was a key reason why Carolina registered its lowest adjusted defensive efficiency ranking since 2002. Yes, the 2002 squad that finished 8-20.
Because when opponents aren’t turning the ball over, they’re using those possessions in another way. This tweet and handy flow chart from Nathan Walker explains it well:
A slightly less rudimentary look at offensive efficiency. pic.twitter.com/ZXRmn40H8X
— Nathan Walker (@bbstats) February 16, 2018
More turnovers reduce shot attempts. More shot attempts reduce turnovers.
If opponents have more shot attempts, that means they have more chances to score.
And if opponents have more chances to score, they’re going to score more.
Remember, there is an order of operations here. Opponents can’t shoot or score if they turnover the ball.
So, if you’re curious if Carolina can improve defensively this upcoming season, one area to investigate is opponent turnover percentage and defensive steal percentage.